A standard deviation is a single number that is used to determine the summaries in a dataset. The standard deviation is a statistical measure that quantifies the deviation between each data point and the mean. Two types of value are given in standard deviation one is a smaller value and the other is a higher value.
This concept is fundamental in statistics and is widely used across various fields to quantify and interpret the degree of spread or concentration within a given set of observations. Understanding standard deviation is key to making informed decisions in fields ranging from finance to quality control and scientific research.
In this article, the definition and formulas of standard deviation will be discussed in detail. Also, we will explore the steps used to evaluate the standard deviation. Moreover, we will discuss this topic with the help of examples.
Definition
In statistics, the standard deviation (often abbreviated as SD) is a measure of how tightly grouped data points are around their mean. SD displays the average difference between the mean and every data point.
Standard deviation key points
- Measuring Dispersion: The standard deviation measures the degree of data dispersion. Data points are more dispersed when the standard deviation is high, whereas a low standard deviation suggests they are clustered near the mean.
- Units with data: Unlike variance, which is the squared standard deviation, the standard deviation is expressed in the same units as the data itself. This makes it easier to interpret and understand in practical contexts.
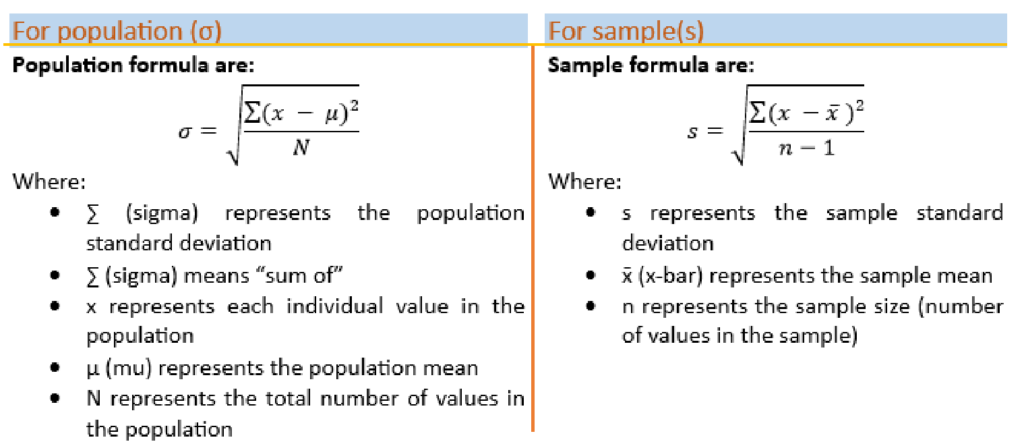
Two different formulas are used to determine standard deviation, one for the standard deviation for the population and the other formula for the sample.

Calculation Steps of Standard Deviation
- Calculate the mean (μ for population, x̄ for sample)
First, we take the sum of all given data and then divide them by the total number of data.
- Determine Mean Deviation:
The method of finding deviation is we determine the difference between each value and the mean.
- Square each difference
Multiply each difference by itself.
- Take the Sum of Squared Differences
Determine the sum of all given squared values.
- Divide by N ( for population) or n – 1 (for sample)
Divide the sum of squared differences by N for the population or n – 1 for the sample.
- Take the square root
The final result is the standard deviation.
Interpreting of SD.
The key to interpreting standard deviation (SD) is realizing how dispersed your data is with the mean. It tells you the typical distance of individual data points from the average value.
Here, we will discuss the interpretation after the breakdown of how to interpret standard deviation
Low Standard Deviation
- Implication: Data points are tightly clustered around the mean, indicating a high degree of consistency and predictability.
- Visualization: On a bell curve, a low standard deviation results in a tall, narrow shape.
Let suppose
- Class scores where most students perform similarly
- Manufacturing processes with consistent output
- Stable investment returns with low volatility
High Standard Deviation
- Implication: Data points are spread out widely from the mean, suggesting greater variability and less predictability.
- Visualization: On a bell curve, a high standard deviation results in a wider, flatter shape.
Let suppose
- Diverse student performance levels in a class
- Manufacturing processes with changing output value
- Volatile investment returns with large price swings
Example section
Example Number 1:
Let’s suppose the monthly Sales Data (in thousands of dollars)
January: 120
February: 150
March: 110
April: 180
May: 130
June: 160
July = 230
Solution
Given data
| January | February | March | April | May | June | July |
| 110 | 130 | 170 | 160 | 145 | 190 | 230 |
Step 1: find mean
µ = (110+130+170+160+145+190+230)/7
µ = 1135/7
µ = 162.143
Step 2: To evaluate the deviations from the mean
For each month, subtract the mean from the sales figure and square the result.
| Monthly sale (xi) | xi – µ | (xi – µ)2 |
| 110 | 110 -162.143 | (-52.143)2=2718.882 |
| 130 | 130-162.143 | (-32.143)2= 1033.166 |
| 170 | 170-162.143 | (7.857)2= 61.734 |
| 160 | 160-162.143 | (-2.143)2= 4.592 |
| 145 | 145-162.143 | (-17.143)2= 293.879 |
| 190 | 190-162.143 | (27.857)2= 776.018 |
| 230 | 230-162.143 | (67.857)2= 4604.586 |
Sum of difference = 2718.882+1033.166+61.734+4.592+293.879+776.018+4604.586 = 9492.857
Step 3:
By using the formula of standard deviation for population
σ = √ 1/7 (9492.86)
σ = √ 1329
σ = 36.46
Example number 2:
Consider the sample data of Customer Satisfaction Ratings on a scale of 1 to 5.
Are 4, 3, 5, 2, 4, 5, 3, 4. Evaluate the customer rating of the standard deviation of sample data
Solution
Given data of customer rating data are
2, 3, 5, 4, 3, 4, 3, 4
Total number of data (n)= 8
Step 1:
Data of input
X = 2, 3, 5, 4, 3, 4, 3, 4
x̄ = Sum of given data/ Total number
x̄ = (2+ 3+ 5+ 4+ 3+ 4+ 3+ 4)/8
x̄ = 28/8
x̄ = 3.5
Step 2:
By using the formula used for sample data, we determine the standard deviation of our sample data
s = √ (1/8-1) ((2−3.5)2+ (3−3.5)2 + (5−3.5)2 + (4−3.5)2 + (3−3.5)2 + (4−3.5)2 + (3−3.5)2 + (4−3.5)2)
s = √ (0.1429) (2.25 + 0.25 + 2.25 + 0.25 + 0.25 + 0.25 + 0.25 + 0.25)
s= √ (0.1429) (6)
s= √ 0.8571
s= 0.93
Summary
In this article definitions and formulas of standard deviation are discussed in detail. Also, we have discussed in detail the steps used to evaluate the standard deviation, interpreting of standard deviation. Moreover, we have discussed in detail with the help of detailed examples.
FAQs
Question number 1:
Can Standard Deviation Be Negative?
Answer:
Clarification on the nature of standard deviation values and why they cannot be negative.
Question number 2:
What Does a High or Low Standard Deviation Mean?
Answer:
Explanation of the implications of high and low standard deviation values in terms of data distribution and consistency.
Question number 3:
How is Standard Deviation Used in Quality Control?
Answer:
Examining the role of standard deviation in assessing and maintaining product quality in manufacturing and quality control processes.


